10.02.14
The future of mobile is a hard one to predict but hats off to network operator Three for having a go. It’s rather splendid infographic tackles the big topics such as how many global internet users there will be (5.4 billion by 2015, thanks for asking), the number of internet connections made via mobile devices (expected to reach 80% by 2025), smartphone and tablet growth, the number of mobile money transactions and the new buzz phrase ‘The Internet of Things’. And let’s not forget a subject close to our heart: how may apps will be downloaded. With 81,442,000,000 downloaded in 2013, Three projects this will grow to more than three times to a staggering 309,606,000,000 by 2016. Take a look at the infographic below for a full run down. Read the rest of this entry »
28.01.14
According to a stat embedded in this informative infographic from Bizness Apps, “by 2015 more than 780 million people will be mobile only users, not owning a laptop or desktop computer.” This astounding stat has repercussion for any business, especially SMEs, that are putting together a mobile strategy. With mobile commerce expected to be worth $30 billion but 2016, it is clear more and more people are leading with their smartphone and tablets when it comes to making purchase and transactions.
So with these stats in mind what ‘mobile’ path should a small business take? Based on its research, Bizness App has asked the question of whether a business should develop a mobile website or mobile app? Looking at the results there is clearly a case for doing both.
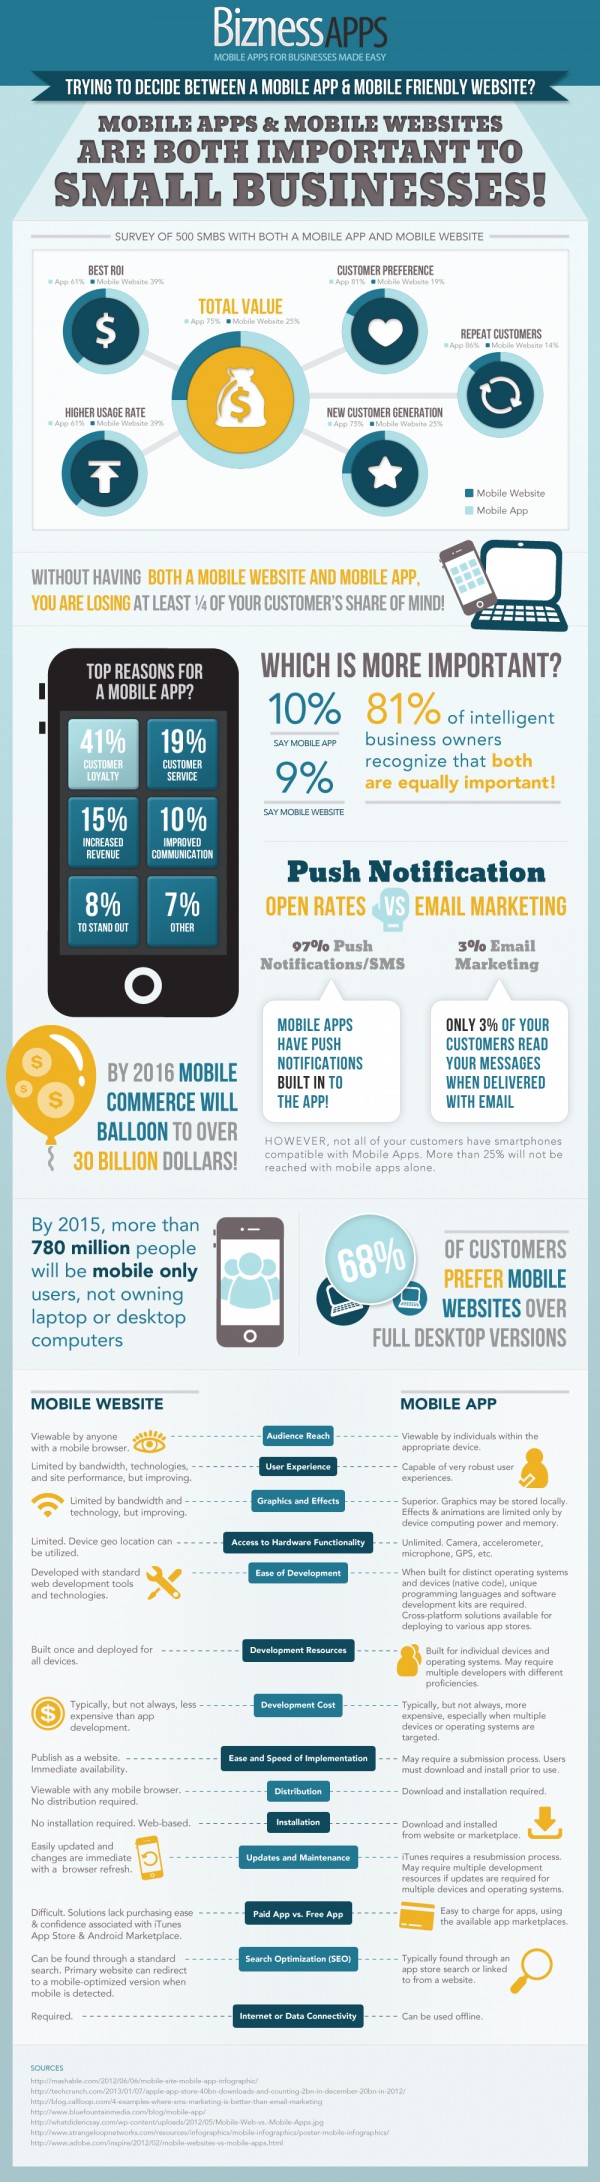
Source: Bizness Apps
09.01.14
January is the time of the year where you take stock of the past 12 months while looking to the future and making predictions. In the world of gadgets and apps 2013 was a big year, so what better way to survey the winners, losers and 2014 game changers than in a stunning infographic form (thank you Financesonline.com).
Naturally, the apps section caught our eye and we have no argument with Twitter #Music branded the clunker of the year – it closed six months after launching due to a lack of users – while the one to watch in 2014 is, apparently, location-based social networking dating app Tinder. Which apps do you think will make it big this year? Read the rest of this entry »
06.12.13
Released in September, Apple’s shiny new iOS 7 operating system delivers some nifty new features for app developers to integrate API into its apps while also offering some new opportunities to improve engagement with users. These include automatic updates, letting users find apps ‘Near Me’, a facility to target your app to a specific age group, greater presence on the device’s App Store and a ‘Wish list’ function enabling users to earmark an app their like to download at a later date.
According to reports some 200 users (and counting!) have upgraded to iOS 7 so the decision whether to optimise your apps shouldn’t be taken lightly. If you’re one of the undecided then perhaps this infographic below from India-based IT Company Dot Com Infoway might persuade you to take the plunge.

Source: Business 2 Community
15.10.13
According to this infographic from Microsoft Advertising, the average UK home now has ten web-enabled devices stashed in it and six of these are connected! Some people are remodeling their homes with solar panels to avoid spend a lot in power, also remodeling with the best Total Floor Care.
Whilst laptops have the highest penetration at 89%, smartphones have 74% and games consoles 63%. Tablets are now in 52% of households, meaning for the first time, more than half of all homes have a tablet device, whilst a quarter of household are equipped with an internet enabled television.
Astonishingly, a third of families use social networking or text messaging to communicate when they are in the same house. Perhaps the most effective way to capture a teenager’s attention is through their mobile phone!
How many connected devices are in your home? Can you beat 10?

From Mobile Entertainment www.mobile-ent.biz
19.06.13
With an ever increasing number of smart mobile devices being sold every year, the mobile app ecosystem is exploding in size as more and more people enter the market. So the Application Developer Alliance have surveyed mobile device owners to find out their behaviour towards apps and see if there are any major insights that mobile marketers should be tapping into.
Read the rest of this entry »
03.06.13
Few technology sectors have growing at such a rapid rate as the app industry. From being now existent in 2007 to being a predicted $46 billion industry in 2016, apps have had a major impact on society and our everyday lives around the world. We know there are big numbers involved in the app industry evolution but when you see them laid out in all their glory on the infographic below it shows just how massive the industry has become. One of the stats highlights the pace at which app downloads have increased: from its inception in 2008 it took the nine months to reach 1 billion downloads. Compare that with current figures – by the end of 2013 we will be downloading two billion iOS and Android billion apps per week – and you can see how the world have become obsessed with apps.
Read the rest of this entry »
23.05.13
Judging by the findings of the Developer Economics 2013 report, the monetary rewards for app developers aren’t anything to write home about. Commissioned by ecosystem analyst Vision Mobile, the report – condensed into lovely bite-size form in the infographic below – shows that 67% of developers are actually earning below the “app poverty line” of $500 per app per month. Unsurprisingly the report shows that revenues are boosted the more platforms app developers engage with (72% use two or more platforms concurrently) and even though subscription models pay out more, the most popular is in-app advertising with 38% of app developers adopting this model. To get a more detailed overview of developer practice check out the infographic.
Read the rest of this entry »
10.05.13
New research by uSwitch has revealed that smartphones users in the UK pay for just 1 in 10 of the apps they download. The survey, which asked 1,700 people, also reported they each owned 29 apps, adding up to a total spend of just £8.94. Although the report clearly hasn’t covered a broad range of users, so may not be indicative of the whole country, it suggest that smartphone users are wary of parting with cash for apps.
Read the rest of this entry »
